Building an OSS Kubernetes Security Console with MCP
Turning open source security signals into an agent-ready investigation layer
Working as a solutions architect while going deep on Kubernetes security — prevention-first thinking, open source tooling, and a daily rabbit hole of hands-on learning. I make the mistakes, then figure out how to fix them (eventually).
A single Kubernetes security finding is rarely the whole story.
That is true whether the signal comes from runtime detection, vulnerability scanning, posture assessment, or admission control.
“Shell spawned in container” might be an emergency. It might also be a noisy debug container, a CI job, or a workload that was just a bad YAML decision.
A critical CVE might be urgent. It might also be buried in a package path the application never touches.
A failed posture check might represent real exposure. It might also be a low-priority control that has been sitting there for six months.
The useful question is not just:
What did this tool find?
It is:
What does this finding mean in context?
What workload is involved? What image is running? Does that image have critical or fixable vulnerabilities? Was the pod already failing posture checks? Did admission control allow something risky? Has the workload triggered suspicious runtime behavior?
Most open source Kubernetes security tools can answer one slice of that.
Falco sees runtime behavior.
Trivy sees vulnerable images.
Kubescape sees posture and compliance drift.
Kyverno sees policy failures and enforcement decisions.
The problem is not that these tools are weak. The problem is that they do not naturally become one investigation surface.
That is what this series is about: building an open source Kubernetes security console that collects posture, vulnerability, policy, and runtime signals, exposes them through Kubernetes-native objects where possible, and wires that data into an MCP server so an AI agent can help triage across the whole stack. Not magic. Not autonomous remediation. Not “AI fixes your cluster while you enjoy a responsible little oat milk latte.” Just structured security data, a sane query layer, and repeatable workflows.
The architectural bet for this series is simple: use Kubernetes CRDs as the shared security data surface wherever possible, then put MCP on top as the query layer. That is the foundation everything else builds on. But this is going to constantly evolve. Don't expect the final product to fit everything I am trying to do here, it is going to be much more.
Follow along here since this will be changing rapidly: https://github.com/sf-matt/k8s-sec-stack
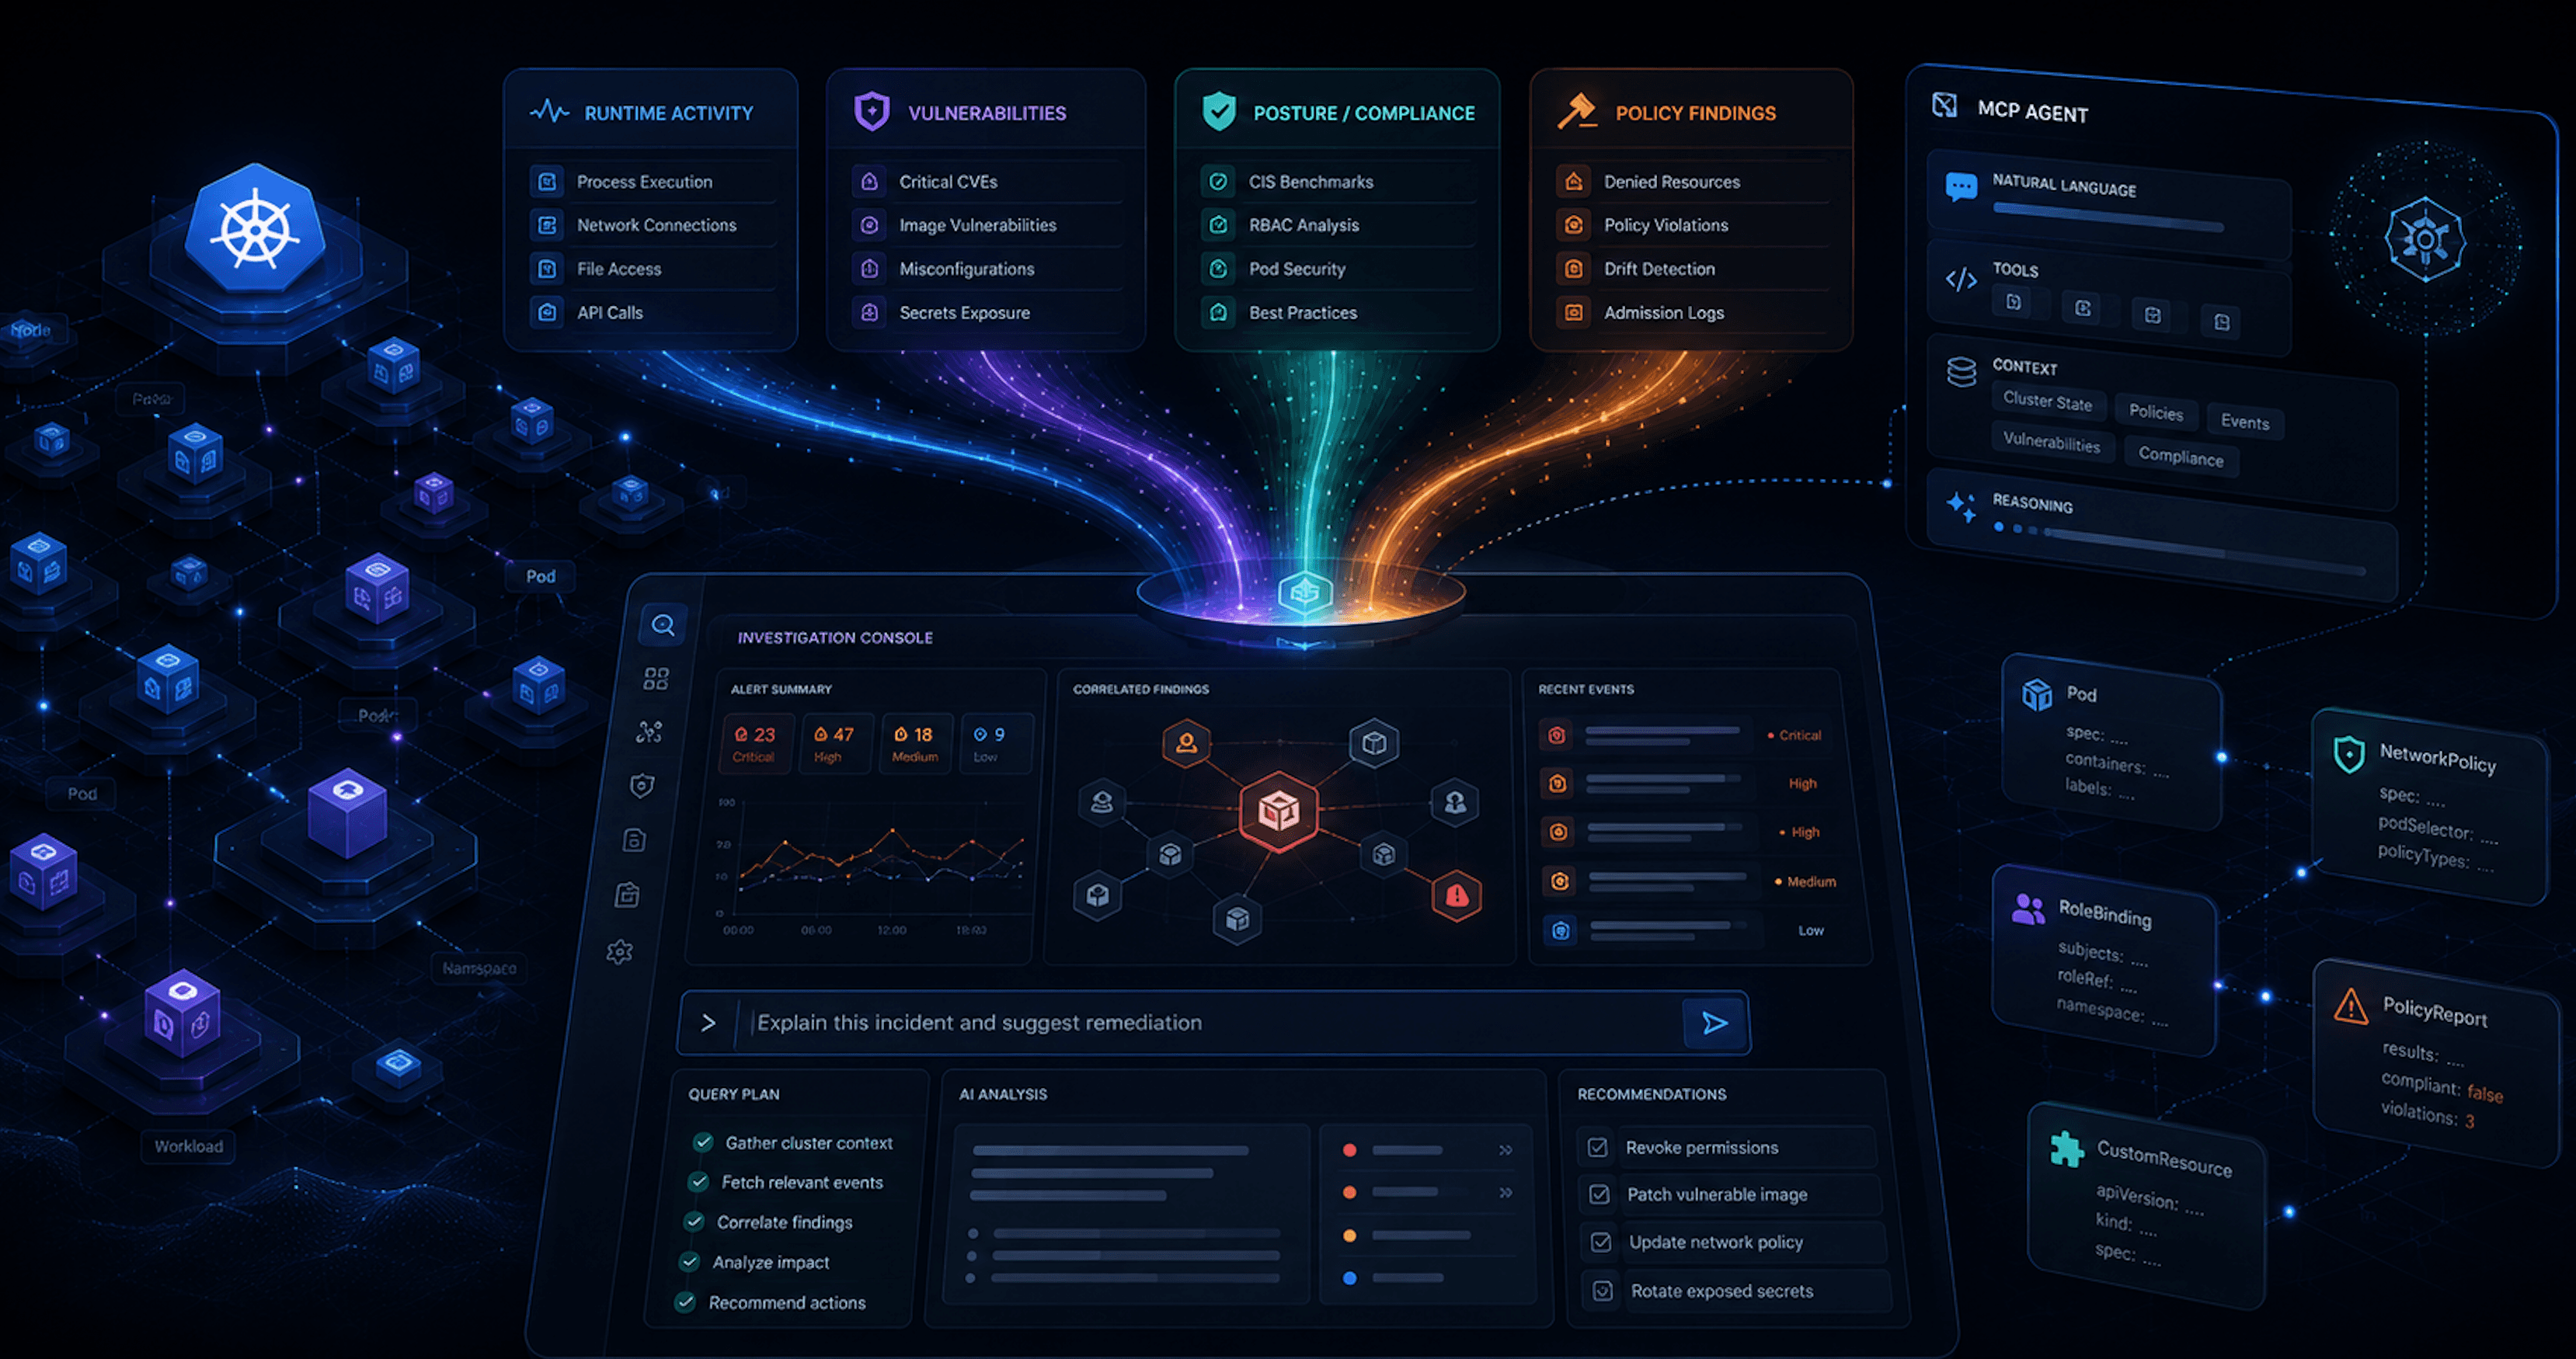
Architecture overview

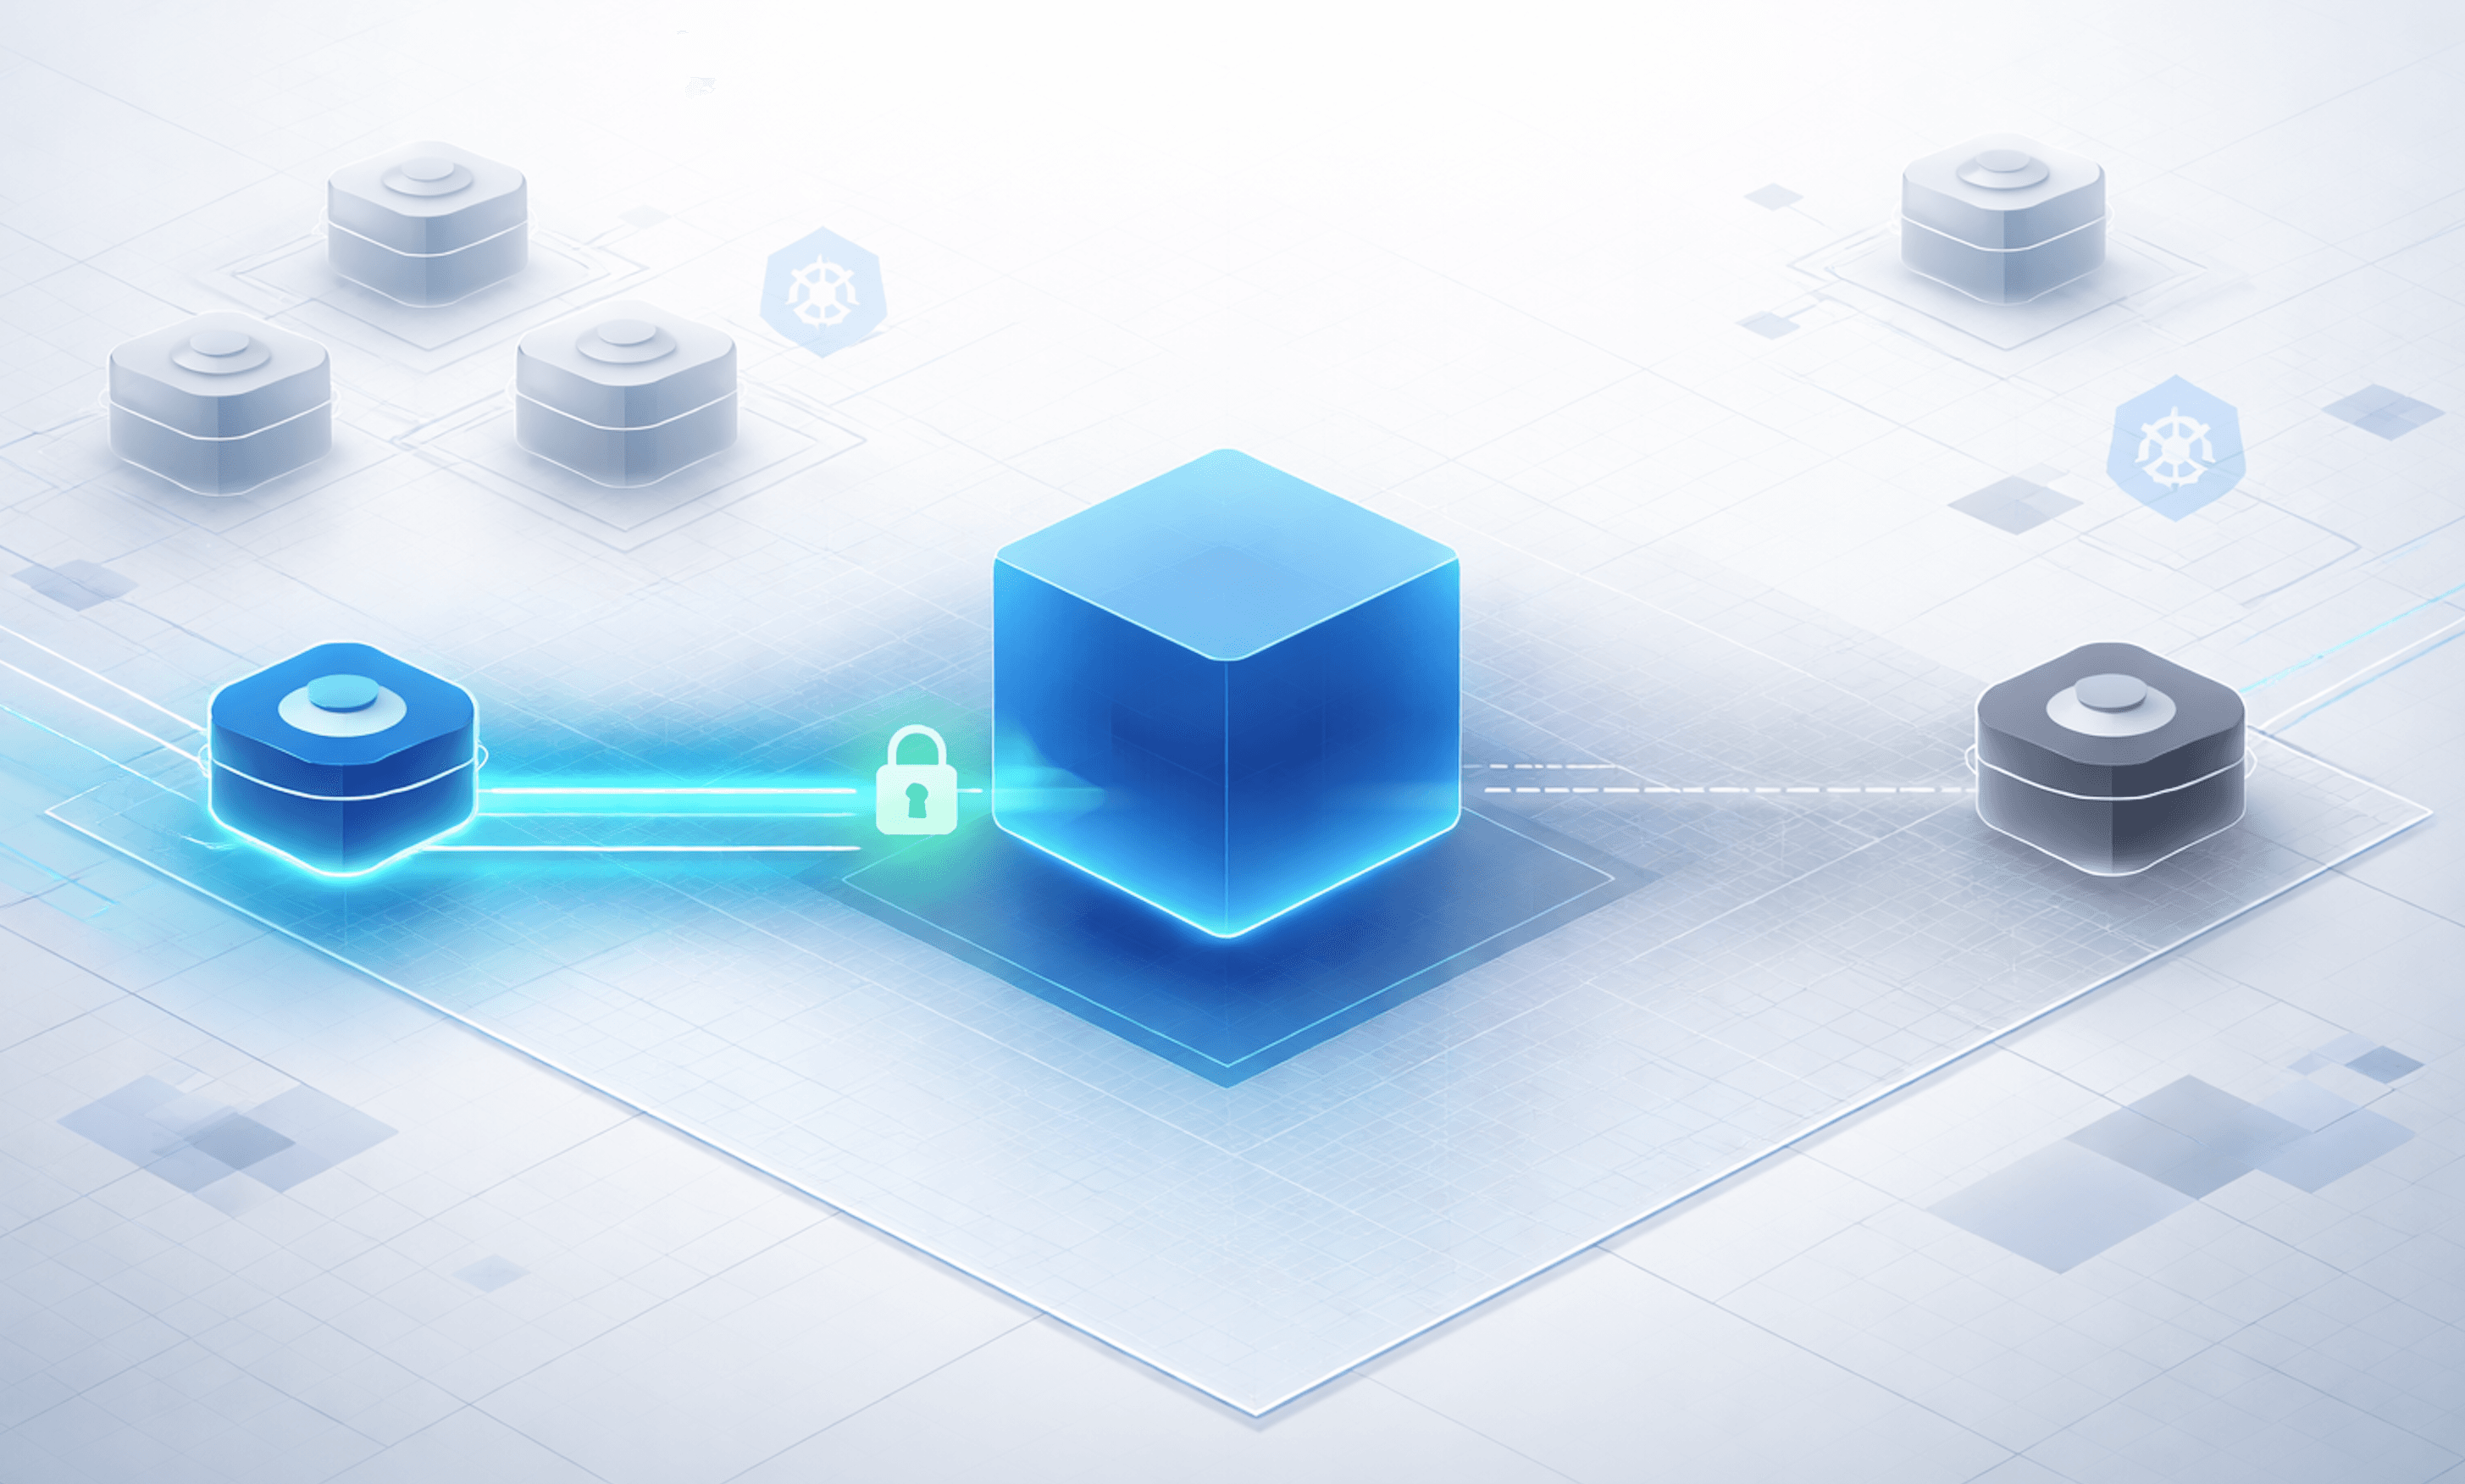
The diagram is intentionally boring in one important way: most of the stack is just Kubernetes resources.
Trivy Operator writes vulnerability findings into the cluster. Kubescape writes posture and compliance findings. Kyverno writes policy results. Those all become queryable through the Kubernetes API.
Falco is the exception. It is built for streaming runtime events, not writing long-lived CRDs. So Falcosidekick routes those events into a lightweight sink that the MCP server can query alongside the slower-moving CRD data.
The split matters:
| Signal | Storage pattern | Why |
|---|---|---|
| Vulnerabilities | CRDs | Tied to images and workloads |
| Posture | CRDs | Tied to controls, resources, and namespaces |
| Policy | CRDs | Tied to admission/background policy results |
| Runtime alerts | Event sink | Fast-moving behavior stream |
That gives the agent two major surfaces to query:
Kubernetes CRDs for durable security state
Runtime event sink for recent behavioral alerts
Everything else builds from there.
Correlation vs Coverage in Action
Let’s make this concrete. Say a workload in the demo namespace triggers a runtime alert:
Unexpected shell spawned in container
namespace=demo
pod=checkout-api-7c9dfb8f6d-k2p9s
container=checkout-api
command=/bin/sh
That is useful, but it is not enough. A shell in a container might be an active compromise. It might be a debug session. It might be a build job doing something that just looks sketchy. It might be nothing. It might be very much not nothing.
The next move is context.
First, identify the workload behind the pod:
kubectl get pod checkout-api-7c9dfb8f6d-k2p9s -n demo \
  -o jsonpath='{.metadata.ownerReferences[0].name}{"\n"}'
Then check the image:
kubectl get pod checkout-api-7c9dfb8f6d-k2p9s -n demo \
  -o jsonpath='{.spec.containers[?(@.name=="checkout-api")].image}{"\n"}'
Now pull vulnerability findings:
kubectl get vulnerabilityreports -n demo
Maybe the image has multiple critical CVEs with fixed versions available. Ok, that might change the story.
Next, check policy results:
kubectl get policyreports -n demo
Maybe Kyverno has been warning that this workload allows privilege escalation or is missing a required security context. Ok, that might change the story.
Then check posture findings:
kubectl get clustercompliancereports
Maybe Kubescape has been flagging risky capabilities, privileged workloads, or weak service account configuration.
Now the alert is no longer just:
Shell spawned in container.
It becomes:
Shell spawned in a workload running an image with fixable critical CVEs,
existing policy audit failures, and known posture issues.
That is a much more useful sentence. It is also the sentence I do not want to manually assemble every time something interesting happens. That workflow works in the same as going up the stairs to the top of Salesforce tower. Technically possible, but I see the elevator.
This is the gap the console is supposed to close. It needs to answer higher-quality questions than any one tool can answer alone:
Show me recent runtime alerts from workloads with critical vulnerabilities.
Summarize risk for the workload that triggered this alert.
Which audit-mode Kyverno findings should become enforced policies first?
The point is not that MCP magically understands Kubernetes security. The point is that MCP can expose specific tools for real cluster data:
list_runtime_events(namespace, hours)
list_vuln_reports(namespace, severity)
list_policy_violations(namespace, result)
list_compliance_reports(framework)
Now we move from coverage to correlation.
No: I have a runtime alert, vulnerability report, posture report, and policy report.
Yes: This specific workload is risky because these signals overlap.
Why CRDs Are the Shared Surface
The architectural bet in this project is simple:
If a Kubernetes security tool can write useful findings back into Kubernetes, that output becomes much easier to correlate.
That is why CRDs matter. Without a shared surface, every tool becomes its own little island of output.
Falco emits runtime events. Trivy can produce scan results. Kubescape can produce posture findings. Kyverno can produce policy results. Each one has value, but each one also has its own format, query model, storage pattern, and operational disorder.
Parse this JSON.
Normalize that field.
Map this pod name to that owner.
Join this image reference to that vulnerability report.
Store this event somewhere.
Hope none of the output formats change next week.
For this stack, I want to avoid as much of that as possible. CRDs give us a better starting point because they turn security findings into Kubernetes-native objects.
That means we get:
One API surface
Kubernetes RBAC
Namespaces
Labels
Owner references
Watch behavior
kubectl compatibility
That does not make CRDs perfect. They are not a SIEM. They are not a data warehouse. They are not where I would store six months of runtime events and pretend I invented observability. But for an in-cluster security console, they are a very useful shared surface.
Security findings as Kubernetes objects
The useful pattern looks like this:
Tool finds something
→ Tool writes a Kubernetes object
→ MCP server queries Kubernetes
→ Agent receives structured security context
That is much cleaner than teaching the agent how to understand every tool’s raw output. The tools in this stack contribute different kinds of Kubernetes-native security state:
| Tool | Primary signal | Kubernetes-native output |
|---|---|---|
| Trivy Operator | Vulnerabilities and config audits | VulnerabilityReport, ConfigAuditReport |
| Kyverno | Policy admission and background results | PolicyReport, ClusterPolicyReport |
| Kubescape | Posture and compliance findings | Compliance and posture-oriented resources |
| Falco | Runtime threat alerts | Event stream through Falcosidekick |
Now slower-moving signals can be queried from the Kubernetes API and tied back to real Kubernetes resources.
Workloads have namespaces. Pods have labels. ReplicaSets have owners. Images are attached to containers. Policy reports reference resources. Vulnerability reports reference images.
The payoff
A simple command already shows the shape of the system:
kubectl get vulnerabilityreports,policyreports -A
Now, multiple tools can write findings into the same operational plane. Once they do that, we can start asking better questions.
Which workloads have critical vulnerabilities?
Which policy failures affect the same namespace?
Which findings belong to the workload that triggered a runtime alert?
Which namespaces have the most overlapping risk?
The console is not starting from nothing. It is starting from objects that already know they live in Kubernetes.
The Falco exception
Falco is the exception to the CRD pattern. That is not a problem. It is just a different kind of signal.
Vulnerability reports, policy results, and posture findings are relatively durable. They describe the current or recent state of workloads and cluster configuration. Runtime alerts are different. They are fast-moving events.
A shell spawned in a container is not cluster state in the same way a failed policy result is cluster state. It is an event that happened at a point in time.
So the architecture handles Falco separately:
Falco
→ Falcosidekick
→ Runtime event sink
→ MCP server
Falcosidekick gives us a clean routing path without forcing runtime alerts into the same model as CRDs. In a production setup, that sink might be Loki, Elasticsearch, Datadog, Splunk, or another event store. For this series, a lightweight HTTP sink is enough to make the pattern work.
The key is that the MCP server can query both surfaces:
Kubernetes CRDs for durable security state
Runtime event sink for recent behavior
Why this matters for MCP
This CRD-first pattern is what makes the agent layer useful. The agent does not need a giant pasted blob of YAML, JSON, logs, and scanner output. It needs tools that can ask specific questions against real data.
Instead of this:
Here is a pile of kubectl output. Please figure out what matters.
We can expose tools like this:
list_vuln_reports(namespace, severity)
list_policy_violations(namespace, result)
list_compliance_reports(framework)
list_runtime_events(namespace, hours)
CRDs give us the shared security surface. The MCP server turns that surface into typed tools. The agent uses those tools to perform repeatable investigations.
That is the difference between bolting a chatbot onto a cluster and building something useful.
MCP and Skills: The Query Layer
CRDs give us the data surface. MCP gives the agent a structured way to query it. So what about the skills.
Instead of pasting a giant blob of Kubernetes output into a prompt, the agent can call typed tools:
list_runtime_events(namespace, hours)
list_vuln_reports(namespace, severity)
list_policy_violations(namespace, result)
list_compliance_reports(framework)
Example workflow:
User asks: Triage the latest high-priority alert.

Agent calls:
1. list_runtime_events()
2. list_vuln_reports()
3. list_policy_violations()
4. list_compliance_reports()
(skill synthesizes findings into a scored recommendation)
That is the difference between asking an LLM to guess from a pile of YAML and giving it a structured investigation path.
A /triage-threat skill might define the workflow:
Start with recent runtime alerts.
Identify the affected pod, workload, namespace, and image.
Pull vulnerability findings for the image.
Pull policy and posture findings for the workload.
Summarize the combined risk.
Recommend next investigation steps.
That is not autonomous remediation, but it is repeatable triage. Autonomous will come later.
What This Does and Does Not Solve
This project is not yet trying to solve all of Kubernetes security in one series. That way lies madness, scope creep, and probably a Helm chart with too many values.
It does give us a useful starting point.
What this gives us
A Kubernetes-native investigation surface
A way to correlate OSS security signals
A repeatable triage workflow
A path from findings to policy
A transparent alternative to black-box security consoles
The important part is transparency. The tools are open. The findings are queryable. The MCP layer is explicit. The skills are workflows we can inspect and improve.
That matters because security consoles often hide too much of the reasoning. A finding gets scored. A recommendation appears. A dashboard says something is critical. Then everyone has to reverse-engineer whether the tool is right or just confidently dramatic. This project should make the reasoning visible.
What this does not give us yet
A SIEM replacement
Autonomous remediation
Long-term event storage
Multi-cluster coverage
Full network visibility
Proof that every CVE is exploitable
That last one matters.
As we know, a CVE is not the same thing as exploitable risk. A posture finding is not the same thing as active compromise. A runtime alert is not the same thing as confirmed malicious activity.
The value is in the overlap.
The first version of this console should help surface that overlap, not pretend every signal has perfect meaning by itself.
Closing: Where the Series Goes Next
This post is the architecture pass. This is a fluid process, but some of the next steps are already shaping up.
I’ll deploy the first version of the stack, confirm the CRDs populate, route Falco events into a sink, and start building the MCP tools that query the data.
Take a Move into skills: triaging a runtime alert, prioritizing risky workloads, turning posture findings into Kyverno policy, and testing where this approach breaks.
The goal is not to bolt AI onto Kubernetes security.The goal is to make open source security signals queryable, correlated, and useful enough to support real triage.