Deploying OSS Kubernetes Security Console
Welcome to the Jungle

Working as a solutions architect while going deep on Kubernetes security — prevention-first thinking, open source tooling, and a daily rabbit hole of hands-on learning. I make the mistakes, then figure out how to fix them (eventually).
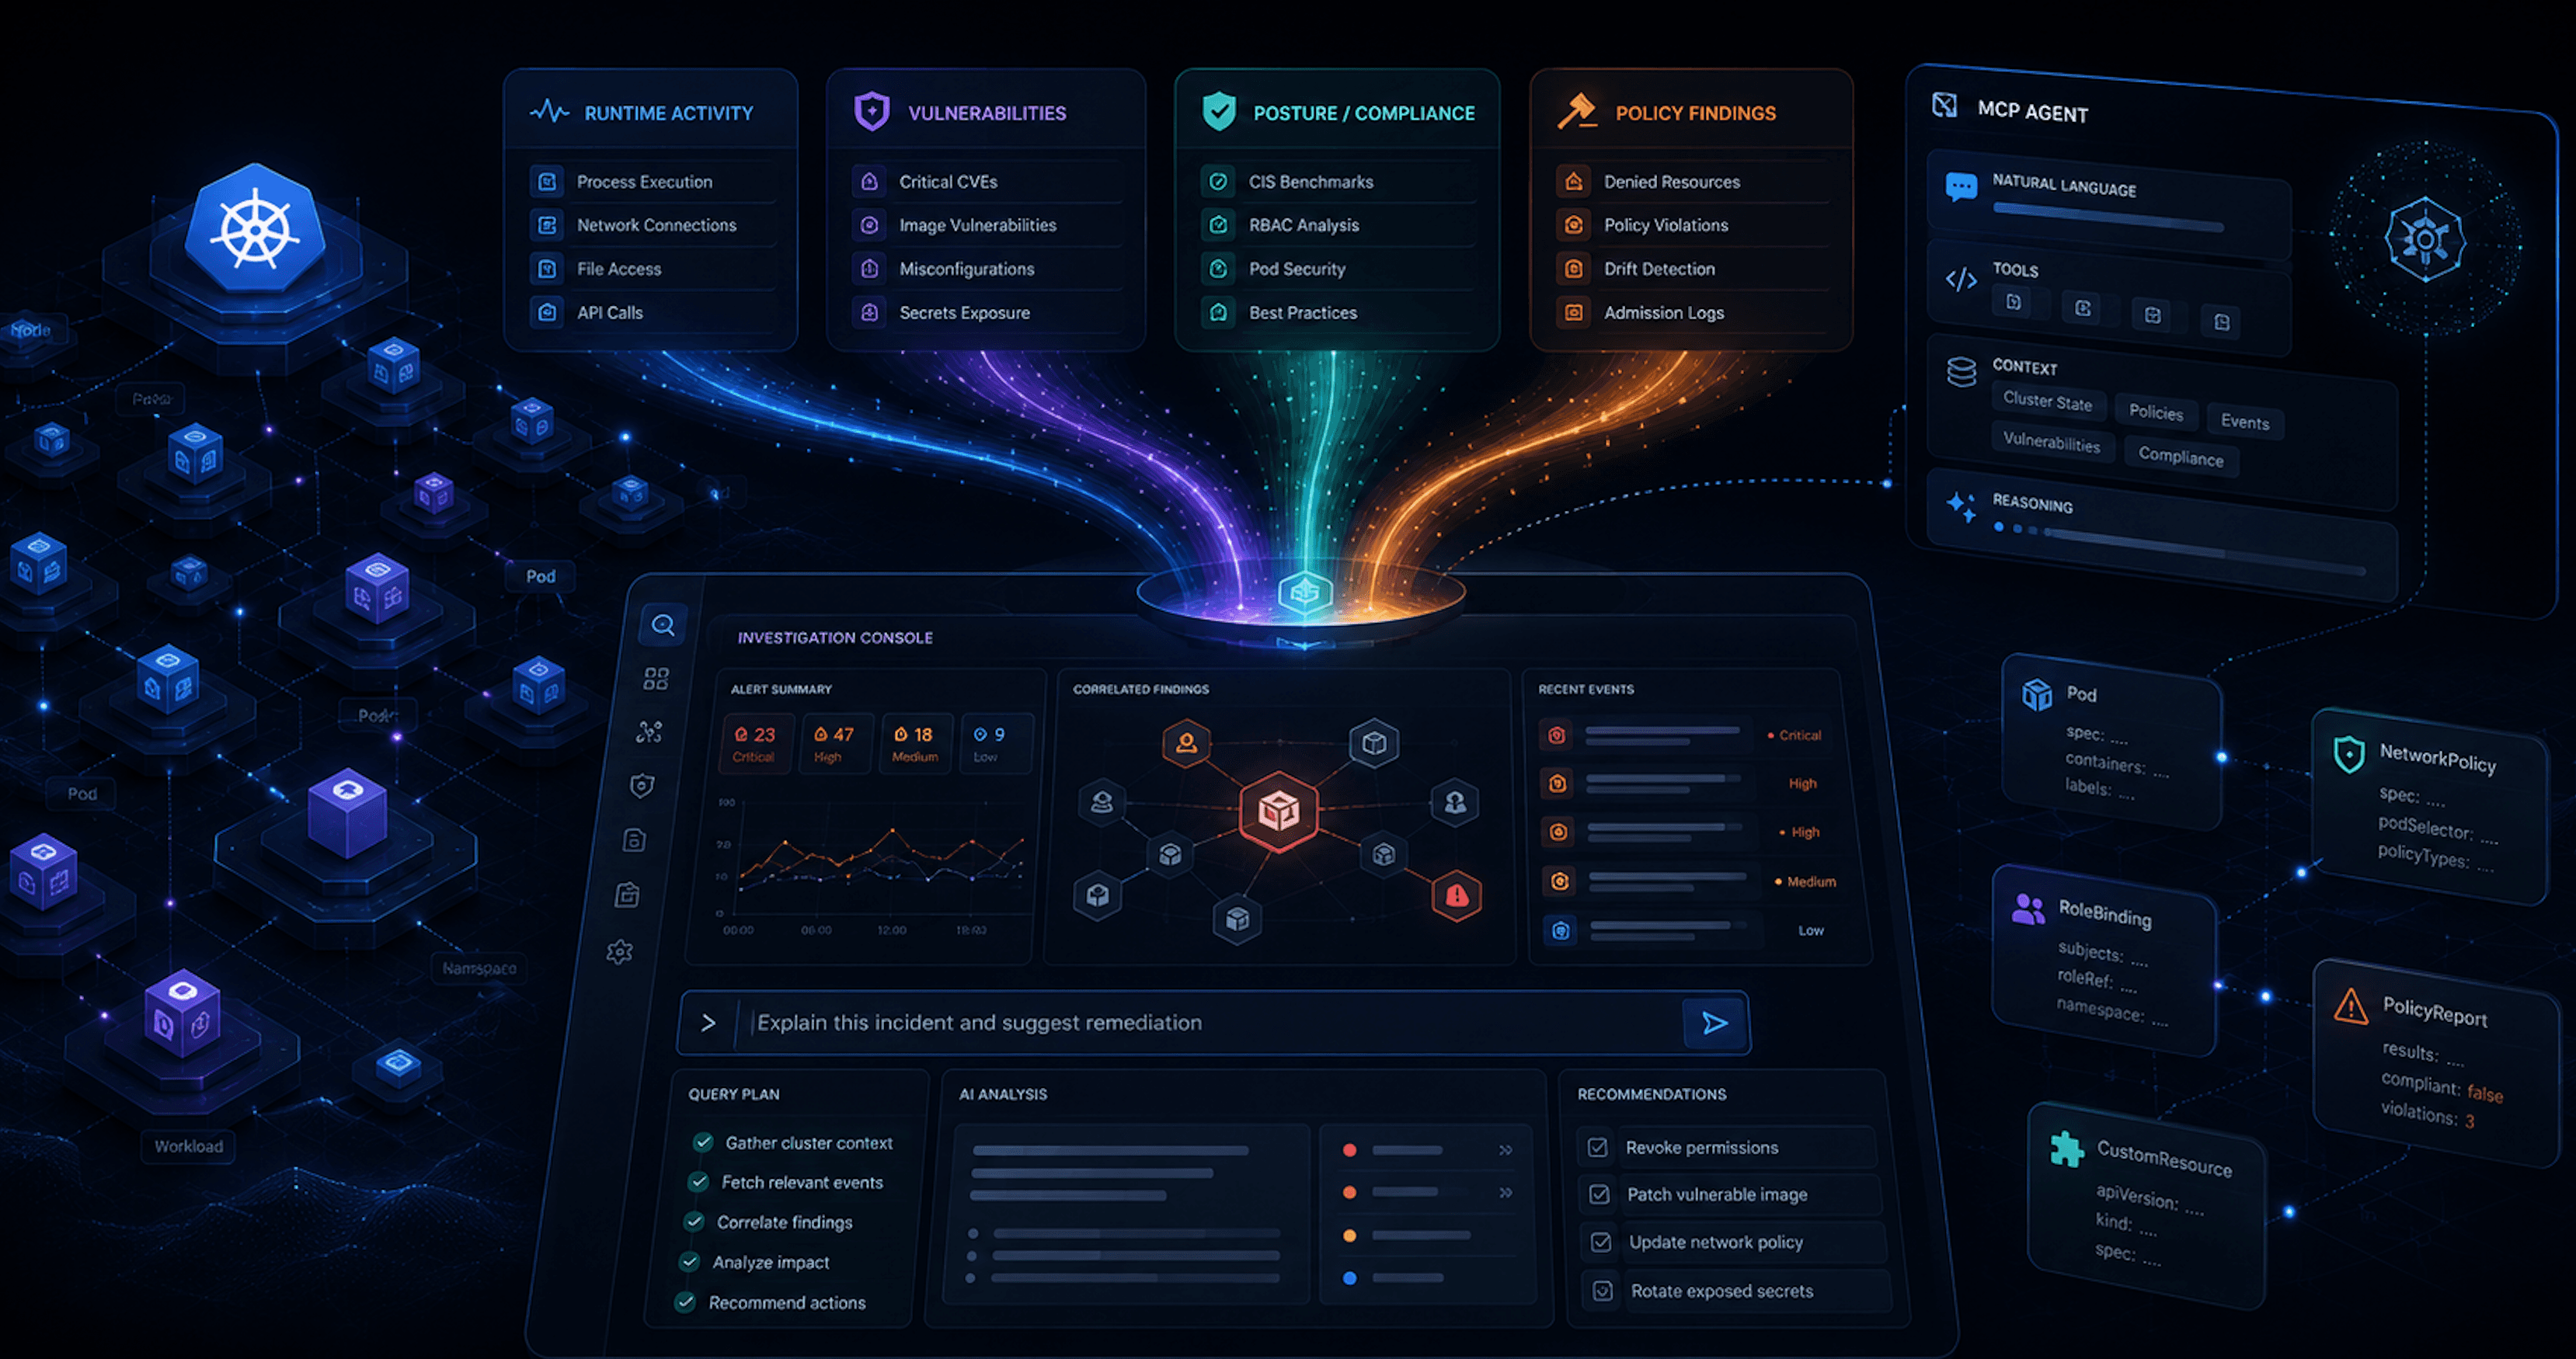
The first post laid out the idea: Kubernetes security tools already produce a lot of useful data, but most of it lands in separate places.
Trivy Operator writes vulnerability and configuration findings into CRDs. Kubescape writes posture and compliance results. Kyverno writes policy reports. Falco emits runtime events. Each tool is useful on its own, but the real value starts when you can pull those signals into one place and ask better questions across them.
This post is the deploy. You can clone the repo and run the stack yourself. Or, if you do not want to spin up a cluster right now, you can still follow the story and see what each piece contributes.
The main point is simple. helm install is not the finish line. The finish line is security data flowing.
What gets deployed
The repo uses a Helm umbrella chart to deploy the core stack:
- Trivy Operator
- Kubescape Operator
- Falco
- Falcosidekick
- Kyverno
- A small MCP event sink for Falco events
The goal is not to build a perfect enterprise platform in one command. That would be suspicious. The goal is to get a working local security data plane.
After the install, the cluster has tools that can answer questions like:
- What vulnerable images are running?
- Which workloads have risky configuration?
- Which Kyverno policies are failing?
- Are runtime events being generated?
- Can an MCP server summarize this without dumping raw YAML into the model?
That last part matters. The Kubernetes API can return a mountain of YAML. The model does not need all of it. The model needs useful summaries.
Deployed is not the same as running
This is the first thing to understand with a stack like this. A Helm chart can install successfully while the security data is still empty. That does not always mean something is broken.
Most Kubernetes security operators follow the same rough pattern:
- Install the operator.
- Register CRDs.
- Watch workloads.
- Launch scans or controllers.
- Write results back into Kubernetes.
There is a delay between "the pod is running" and "the finding exists." So after deployment, I do not start by asking kube basic questions:
kubectl get pods -A
That is useful, but it only tells me the components are alive.
The better question is:
kubectl get vulnerabilityreports -A
kubectl get policyreports -A
kubectl get clustercompliancereports
That tells me whether the stack is producing data. Pods are table stakes. Findings are the point.
The deploy flow
The short version looks like this:
kubectl cluster-info

git clone https://github.com/sf-matt/k8s-sec-stack
cd k8s-sec-stack

./hack/bootstrap.sh
kubectl apply -f demo/
./hack/configure-local.sh
Then restart Claude Code from the project directory so it picks up the generated MCP config. That is the happy path. Under the hood, bootstrap.sh is doing the normal Helm work:
helm repo add falcosecurity https://falcosecurity.github.io/charts
helm repo add aqua https://aquasecurity.github.io/helm-charts
helm repo add kubescape https://kubescape.github.io/helm-charts
helm repo add kyverno https://kyverno.github.io/kyverno
helm repo update

helm dependency update ./charts/k8s-sec-stack

helm upgrade --install k8s-sec-stack ./charts/k8s-sec-stack \
  --namespace security \
  --create-namespace \
  --wait \
  --timeout 10m
The umbrella chart keeps the install simple. One chart pulls in the tool-specific charts and passes configuration down to each subchart. That gives us one repeatable entry point instead of four separate install guides taped together.
The demo workload
After the stack is deployed, the repo applies demo workloads:
matt.brown@matt k8s-sec-stack % kubectl apply -f demo/
namespace/demo configured
These workloads are intentionally not clean. That is the point. A perfectly clean demo cluster is very calming, and also useless. The demo workloads give the tools something to detect:
- Trivy can find image vulnerabilities.
- Kubescape can flag insecure workload configuration.
- Kyverno can produce policy violations.
- Falco can generate runtime events when we interact with the workload.
This turns the stack from "installed tools" into "tools producing evidence."
Verifying Trivy Operator
Trivy Operator writes results into CRDs. The first check is whether the operator is running:
matt.brown@matt k8s-sec-stack % kubectl get deploy k8s-sec-stack-trivy-operator -n security
NAME                           READY   UP-TO-DATE   AVAILABLE   AGE
k8s-sec-stack-trivy-operator   1/1     1            1           9d
Then check whether reports are appearing:
matt.brown@matt k8s-sec-stack % kubectl get vulnerabilityreports -A | head -5
NAMESPACE            NAME                                                              REPOSITORY                         TAG           SCANNER   AGE
calico-apiserver     replicaset-calico-apiserver-6db954fd57-calico-apiserver           calico/apiserver                   v3.25.0       Trivy     21m
calico-system        daemonset-calico-node-calico-node                                 calico/node                        v3.25.0       Trivy     25m
calico-system        daemonset-csi-node-driver-calico-csi                              calico/csi                         v3.25.0       Trivy     23m
calico-system        daemonset-csi-node-driver-csi-node-driver-registrar               calico/node-driver-registrar       v3.25.0       Trivy     23m
matt.brown@matt k8s-sec-stack % kubectl get configauditreports -A | head -5
NAMESPACE            NAME                                                  SCANNER   AGE
calico-apiserver     networkpolicy-allow-apiserver                         Trivy     9d
calico-apiserver     replicaset-calico-apiserver-6db954fd57                Trivy     9d
calico-apiserver     service-calico-api                                    Trivy     9d
calico-system        daemonset-calico-node                                 Trivy     9d
If those are empty immediately after install, wait a few minutes. Trivy Operator needs time to watch workloads, create scan jobs, run scans, and write results. If they are still empty after several minutes, check the operator logs:
kubectl logs -n security deploy/k8s-sec-stack-trivy-operator
This is the pattern for the whole stack. Do not stop at "the deployment exists." Check that the deployment is producing the thing you actually need.
Verifying Kubescape
Kubescape has more moving parts. It includes scanner components, storage, vulnerability scanning, compliance reporting, and a node agent.
Start with:
kubectl get deploy -n kubescape
kubectl get pods -n kubescape
Then check for compliance reports:
matt.brown@matt k8s-sec-stack % kubectl get clustercompliancereports
NAME                     AGE
k8s-cis-1.23             9d
k8s-nsa-1.0              9d
k8s-pss-baseline-0.1     9d
k8s-pss-restricted-0.1   9d
The useful check is the report status:
matt.brown@matt k8s-sec-stack % kubectl get clustercompliancereport k8s-nsa-1.0 -o json | jq '.status.summary'
{
  "failCount": 12,
  "passCount": 15
}
You want to see pass and fail counts. If the report exists but the counts are zero, it may not be done yet.
matt.brown@matt k8s-sec-stack % kubectl get clustercompliancereport k8s-nsa-1.0 -o json | jq '.status'
{
  "summary": {
    "failCount": 12,
    "passCount": 15
  },
  "summaryReport": {
    "controlCheck": [
      {
        "id": "1.0",
        "name": "Non-root containers",
        "severity": "MEDIUM",
        "totalFail": 27
      },
...
Verifying Kyverno
Kyverno gives us admission control and policy reporting.
First check the controllers:
kubectl get deploy -n security | grep kyverno
Then check that the webhook exists:
matt.brown@matt k8s-sec-stack % kubectl get validatingwebhookconfigurations | grep kyverno
kyverno-cel-exception-validating-webhook-cfg    1          9d
kyverno-cleanup-validating-webhook-cfg          1          9d
...
Then check for policy reports:
matt.brown@matt k8s-sec-stack % kubectl get policyreports -A | head -5
NAMESPACE            NAME                                   KIND         NAME                                             PASS   FAIL   WARN   ERROR   SKIP   AGE
calico-apiserver     2d6b9b43-432f-4475-82cc-564f3efcdbbe   Pod          calico-apiserver-6db954fd57-xz6l5                3      4      0      0       0      9d
calico-apiserver     7e6a00c6-fa0e-419e-ab10-ffccd068983a   Pod          calico-apiserver-6db954fd57-v4klw                3      4      0      0       0      9d
calico-apiserver     e1f55f30-87dc-433e-9820-2210fad5d5c8   Deployment   calico-apiserver                                 3      4      0      0       0      9d
calico-apiserver     f8f9db44-0fd9-4bef-80eb-8c9418b5f6cf   ReplicaSet   calico-apiserver-6db954fd57                      3      4      0      0       0      9d
And count failed policy results:
matt.brown@matt k8s-sec-stack % kubectl get policyreports -A -o json | \
  jq '[.items[].results[] | select(.result=="fail")] | length'
207
This is where the console idea starts to become more obvious. Kyverno and Kubescape can both produce policy-style findings. Instead of treating them as totally separate worlds, the MCP layer can summarize those findings into a shared view. That is the beginning of an actual security console. A place where signals can be queried, summarized, and used.
Verifying Falco
Falco is different from the others. Trivy, Kubescape, and Kyverno write structured results into Kubernetes CRDs. Falco emits runtime events. So the verification path is different. Check that Falco is running on each node:
kubectl get ds k8s-sec-stack-falco -n security
In this stack, Falco sends events to Falcosidekick, and Falcosidekick forwards them to a small event sink. The sink stores events so the MCP server can query them later.
Trigger a basic event:
kubectl run falco-test-shell --image=alpine --restart=Never --rm -- sh -c 'whoami' && sleep 5 && curl -s http://\(NODE_IP:\)NODE_PORT/events | jq -r '.[].rule' | sort | uniq -c | sort -nr | head
Then check the sink:
matt.brown@matt k8s-sec-stack % NODE_IP=$(kubectl get nodes -o jsonpath='{.items[0].status.addresses[?(@.type=="InternalIP")].address}')
NODE_PORT=$(kubectl get svc mcp-event-sink -n security -o jsonpath='{.spec.ports[0].nodePort}')
matt.brown@matt k8s-sec-stack % curl -s http://\(NODE_IP:\)NODE_PORT/events | jq '.[-1] | {
  time: .time,
  rule: .rule,
  priority: .priority,
  output: .output
}'
{
  "time": "2026-06-03T06:09:21.286989548Z",
  "rule": "Terminal shell in container",
  "priority": "Notice",
  "output": "06:09:21.286989548: Notice A shell was spawned in a container with an attached terminal | evt_type=execve user=root user_uid=0 user_loginuid=-1 process=sh proc_exepath=/bin/busybox parent=containerd-shim command=sh -c whoami terminal=34816 exe_flags=EXE_WRITABLE|EXE_LOWER_LAYER container_id=5df14fcd55f9 container_name=test-shell container_image_repository=docker.io/library/alpine container_image_tag=latest k8s_pod_name=test-shell k8s_ns_name=default"
}
That is the Falco equivalent of “the CRD has data.”
Connecting the MCP server
The MCP server runs locally. It is not deployed inside the cluster. That is intentional. It connects to Kubernetes through your local kubeconfig, queries the cluster API, and exposes a smaller set of tools to Claude Code.
Run:
./hack/configure-local.sh
That writes local MCP config for the project:
.mcp.json
.claude/settings.json
These files are machine-specific and gitignored. The generated config tells Claude Code how to launch the MCP server and where to find the Falco event sink. After that, restart Claude Code from the repo directory.
Then check:
/mcp
If the tools show up, Claude Code can talk to the MCP server. If they do not, run the server manually:
uv run --project mcp-server k8s-sec-mcp
Common issues are usually boring:
- wrong working directory
- kubeconfig pointed at the wrong cluster
- missing Python dependency
- MCP SDK version mismatch
Boring issues still count.
Why summarize instead of dumping YAML? (This just changed!)
The MCP tools are not just wrappers around kubectl get. That would technically work, but it would be expensive and noisy. A raw Trivy VulnerabilityReport can be hundreds of lines. A cluster can have many of them. Most of that data does not need to go into the model.
The MCP tool should return the useful part:
{
  "image": "sfmatt/flask-vuln-demo:latest",
  "critical_count": 2,
  "high_count": 8,
  "fixable_count": 3,
  "unfixable_count": 7
}
That is the design principle for this project:
- Deterministic aggregation belongs in the tool.
- Reasoning belongs in the model.
So the MCP server should handle things like:
- counting findings
- grouping by image
- deduplicating repeated CVEs
- summarizing policy failures
- filtering noisy raw fields
The model should handle things like:
- explaining what matters
- suggesting priority
- connecting related signals
- generating next-step remediation ideas
That boundary is the difference between an MCP server that helps and an MCP server that blasts out input tokens.
The practical checklist
After deployment, we proved four things:
- Trivy data exists
- Kubescape data exists
- Kyverno data exists
- Falco events exist
If those are working, the stack is no longer just installed. It is producing security signals. That is the minimum viable console layer.
Wrap Up
At this point, we have:
- deployed the stack
- added demo workloads
- verified that each tool produces data
- connected a local MCP server
- started translating raw security objects into summaries
This is still early. It is not a polished product. It is not trying to be one yet.
But it is enough to prove Kubernetes security tools can produce structured signals and MCP tools can summarize those signals. Then the LLM can reason across them without needing every raw CRD dumped into context.
The next step is making the MCP layer more intentional. We will add better tools, better summaries, and better workflows for turning scattered findings into actual security decisions.