Trivy Operator: The Scanner That Leaves Receipts
A practical walkthrough of how Trivy Operator turns image, config, secret, and RBAC findings into Kubernetes-native reports.

Working as a solutions architect while going deep on Kubernetes security — prevention-first thinking, open source tooling, and a daily rabbit hole of hands-on learning. I make the mistakes, then figure out how to fix them (eventually).
I’ve been working through a bigger Kubernetes security stack, and I wanted to come back to one of the simpler pieces: scanning.
Not runtime blocking. Not admission control. Just scanning.
Trivy Operator is useful because it takes something familiar, Trivy scans, and makes it Kubernetes-native. Instead of running a one-off command against an image or manifest, the operator runs inside the cluster and creates reports you can query with kubectl.
That makes it a good fit for the Kubernetes security MCP work I’ve been exploring. Before you can summarize, correlate, or reason over security findings, you need findings in a place where the system can actually read them.
So this post is a practical reset. I’m going to install Trivy Operator, look at what it creates, trigger a few findings, and use it to understand how scanning fits into the broader Kubernetes security stack.
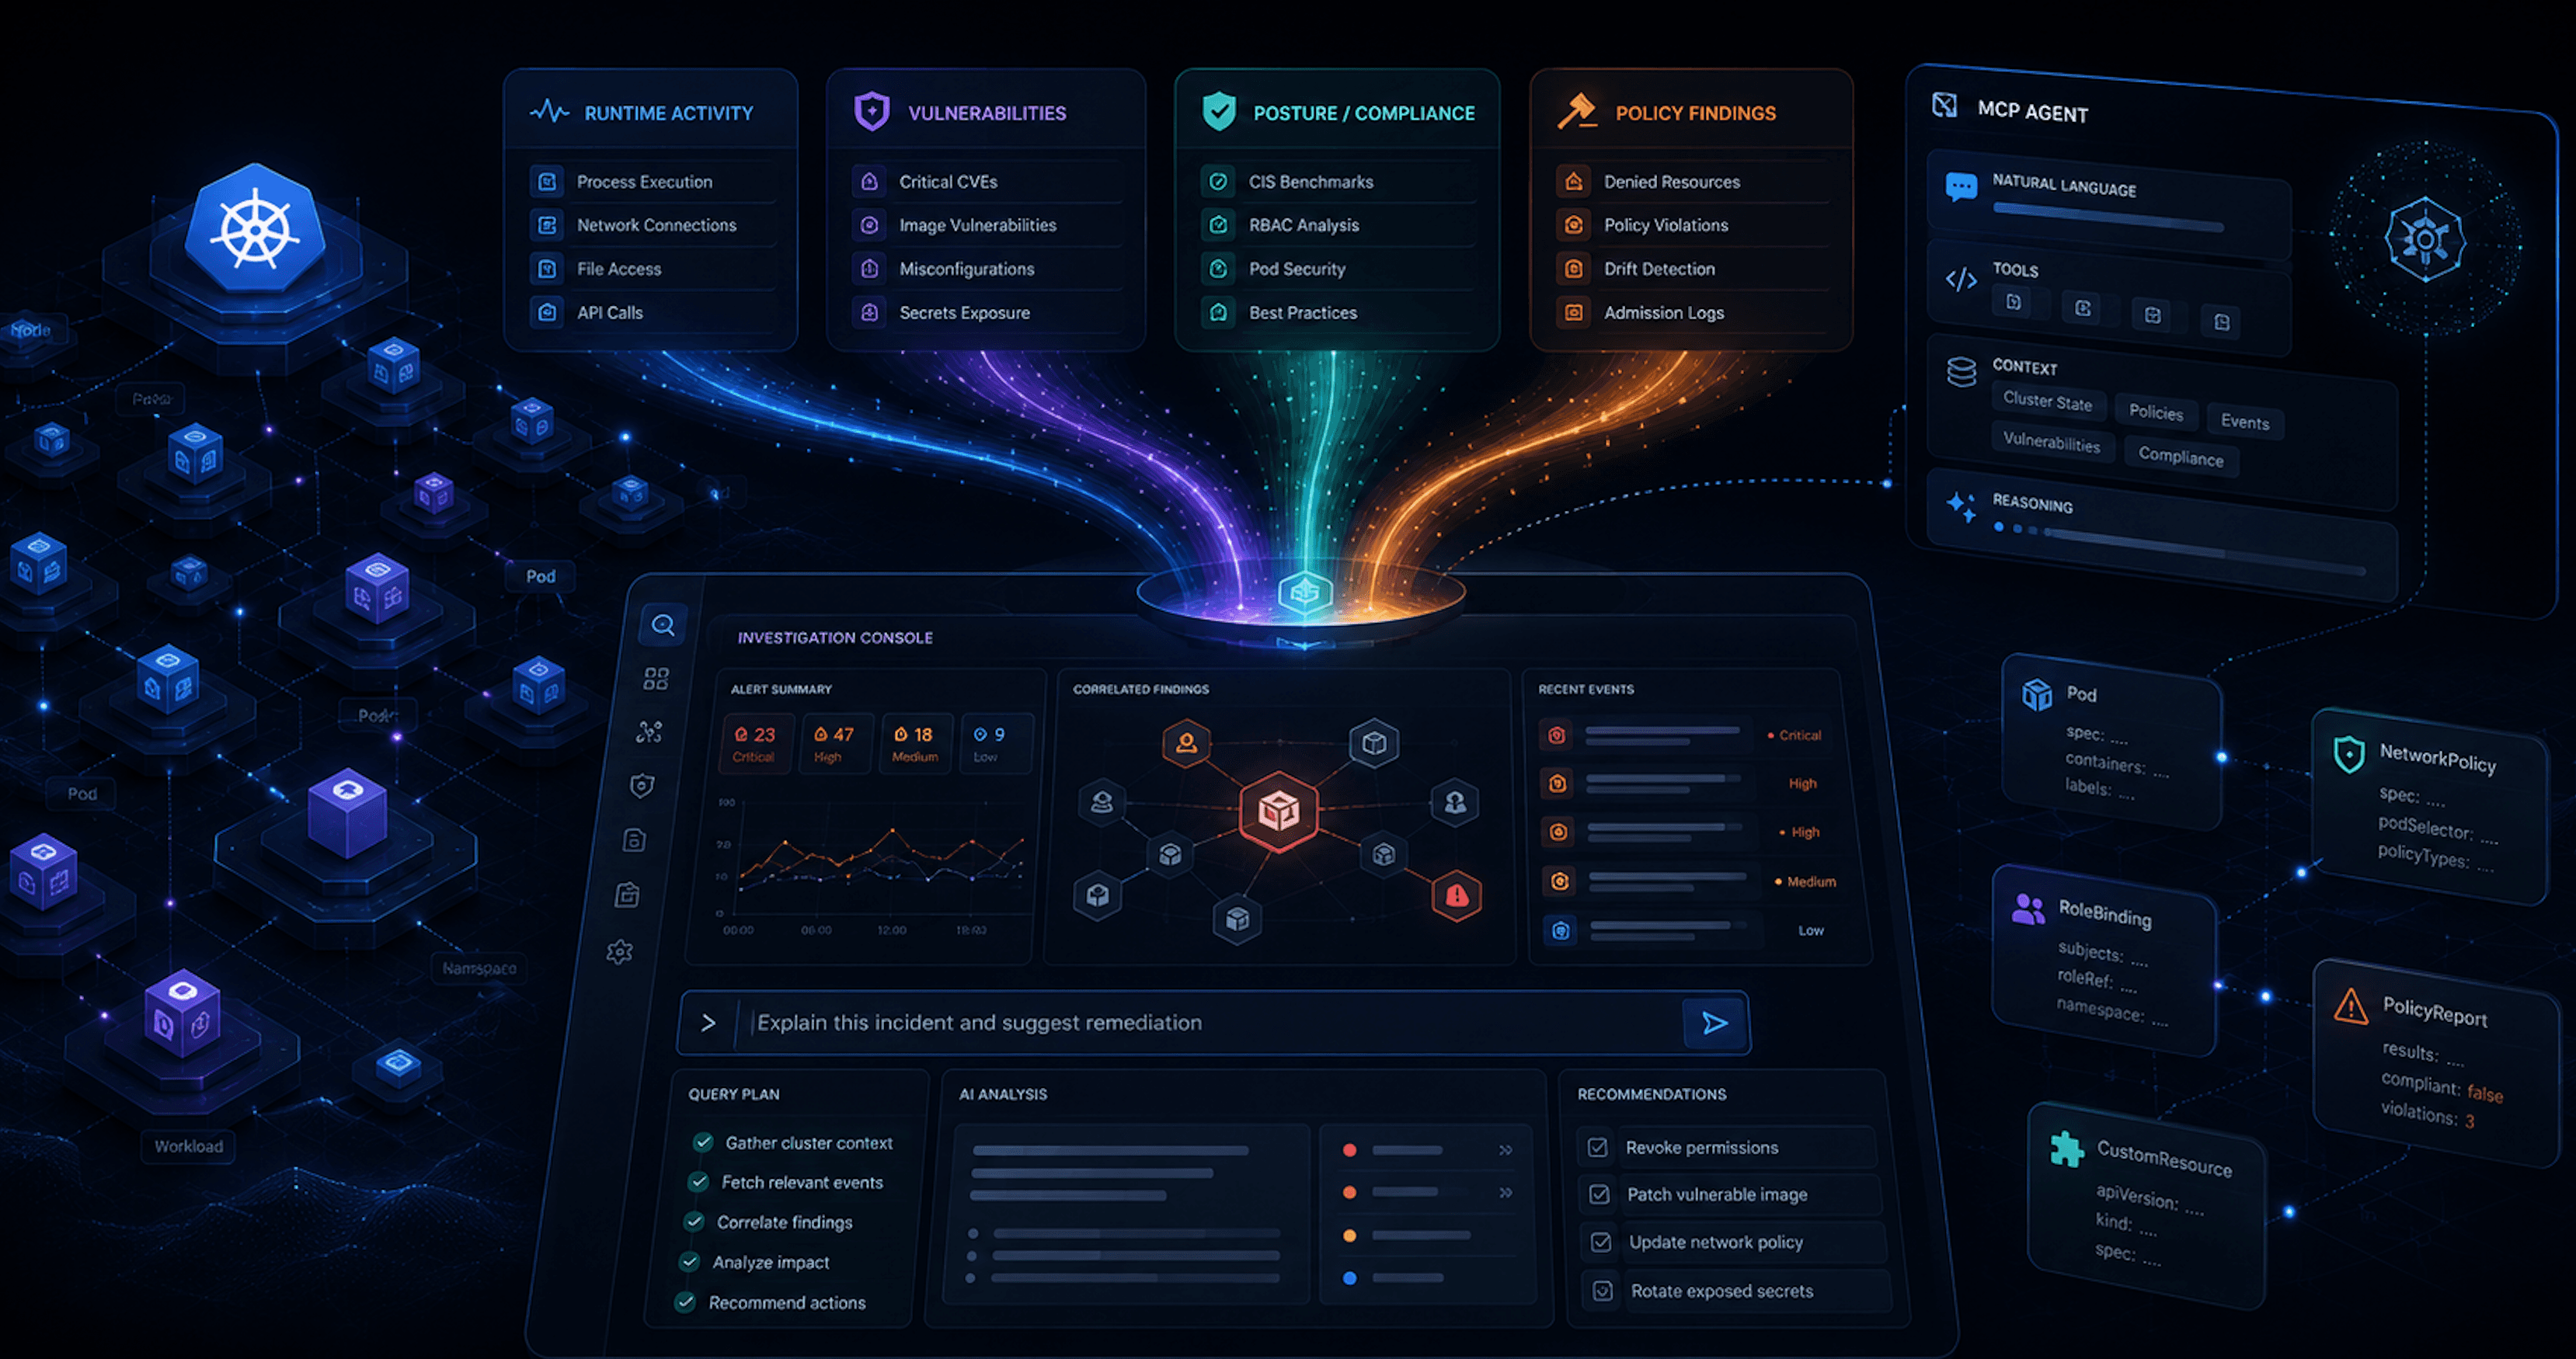
Diagram

The key idea is that Trivy Operator turns scanning into a Kubernetes control loop. Instead of manually running Trivy and saving output somewhere, the operator watches cluster resources, runs scans when there is something to evaluate, and writes the results back as report CRDs.
That matters because the output is no longer just scanner output. It becomes Kubernetes-native security data that can be queried with kubectl, consumed by scripts, or fed into a larger security workflow later.
Setting Up Trivy Operator and Understanding the CRDs
Trivy Operator is not just “Trivy, but installed with Helm.”
That is part of it, obviously. But the useful shift is that Trivy Operator turns scan output into Kubernetes resources. Instead of running a scan locally, saving JSON somewhere, and deciding what to do with it later, the operator watches the cluster and writes findings back into the API server as custom resources. That makes the setup worth understanding.
The install is simple. The model is the interesting part.
helm repo add aqua https://aquasecurity.github.io/helm-charts/
helm repo update

helm install trivy-operator aqua/trivy-operator \
  --namespace trivy-system \
  --create-namespace
After the operator is running, the first thing to check is not a dashboard. It is the CRDs.
matt@ciliumcontrolplane:~$ kubectl get crds | grep aquasecurity
clustercompliancereports.aquasecurity.github.io        2026-05-28T21:18:38Z
clusterconfigauditreports.aquasecurity.github.io       2026-05-28T21:18:38Z
clusterinfraassessmentreports.aquasecurity.github.io   2026-05-28T21:18:39Z
clusterrbacassessmentreports.aquasecurity.github.io    2026-05-28T21:18:39Z
clustersbomreports.aquasecurity.github.io              2026-05-28T21:18:39Z
clustervulnerabilityreports.aquasecurity.github.io     2026-05-28T21:18:39Z
configauditreports.aquasecurity.github.io              2026-05-28T21:18:39Z
exposedsecretreports.aquasecurity.github.io            2026-05-28T21:18:39Z
infraassessmentreports.aquasecurity.github.io          2026-05-28T21:18:39Z
rbacassessmentreports.aquasecurity.github.io           2026-05-28T21:18:39Z
sbomreports.aquasecurity.github.io                     2026-05-28T21:18:39Z
vulnerabilityreports.aquasecurity.github.io            2026-05-28T21:18:39Z
The exact list may vary by version and configuration, but the idea is the same: Trivy Operator creates Kubernetes-native report types for different categories of security findings.
Trivy Operator is not just producing scanner output. It is creating objects you can query.
kubectl get vulnerabilityreports -A
kubectl get configauditreports -A
kubectl get exposedsecretreports -A
kubectl get rbacassessmentreports -A
That changes how the findings fit into the rest of the stack.
A one-off scan is useful when you are checking something manually. A CRD-backed report is useful when you want other systems to consume it. You can query it with kubectl, scrape it into another workflow, export it, summarize it, or use it as input for a larger security console.
For Kubernetes security MCP work, this is the part that matters most.
The operator gives us structured security findings that already live inside the cluster. We do not need to invent the scanning layer first. We can start by understanding what Trivy Operator reports, how those reports are shaped, and which findings are actually useful enough to reason over later.
At this point, the mental model is pretty simple:
Kubernetes workload exists
        ↓
Trivy Operator notices it
        ↓
Trivy scans the relevant target
        ↓
The operator writes a report CRD
        ↓
Humans and systems query the report
Trivy Operator gives us those raw materials as Kubernetes resources.
Triggering a Scan with a Bad Workload
Now that Trivy Operator is installed, the easiest way to understand what it does is not to stare at the CRD list. The easiest and most burrito way is to give it something to scan.
That is the part I like about the operator model. We are not going to manually run trivy image nginx:1.16 from our laptop and then decide where to stash the output. That works, but it is still a one-off scanner workflow.
With Trivy Operator, we create Kubernetes state and let the operator react to it. So let’s create a small workload that should produce useful findings.
This example uses an older nginx image and a weak container securityContext. The stale image should give us vulnerability data, while the workload configuration should give us something to look for in the config audit report.
apiVersion: apps/v1
kind: Deployment
metadata:
  name: trivy-demo-nginx
  namespace: default
spec:
  replicas: 1
  selector:
    matchLabels:
      app: trivy-demo-nginx
  template:
    metadata:
      labels:
        app: trivy-demo-nginx
    spec:
      containers:
        - name: nginx
          image: nginx:1.16
          securityContext:
            allowPrivilegeEscalation: true
            runAsNonRoot: false
Apply it:
kubectl apply -f trivy-demo-nginx.yaml
At this point, we have not directly invoked Trivy at all. That is important.
The trigger is not a CLI command. The trigger is Kubernetes state. A workload exists in the cluster, and Trivy Operator is watching for resources it knows how to scan.
If everything is working, the operator should eventually create report resources based on that workload. This may take a little bit depending on image pull time, scanner job scheduling, cluster size, and the operator configuration.
Start by checking for vulnerability reports:
matt@ciliumcontrolplane:~/trivy$ kubectl get vulnerabilityreports -A
NAMESPACE      NAME                                                    REPOSITORY                TAG                                                           SCANNER   AGE
default        replicaset-trivy-demo-nginx-855b887fb-nginx             library/nginx             1.16                                                          Trivy     5m17s
...
You should see a report tied to the workload or ReplicaSet created by the deployment. The exact name may vary because the report is usually associated with the workload resource and container being scanned.
You can also check for config audit reports:
matt@ciliumcontrolplane:~/trivy$ kubectl get configauditreports -A
NAMESPACE      NAME                                             SCANNER   AGE
default        replicaset-trivy-demo-nginx-855b887fb            Trivy     7m24s
...
This is where the second half of the test comes in. Vulnerability scanning looks at the container image. Config auditing looks at how Kubernetes is being asked to run that image.
While, the image might have CVEs because it includes vulnerable packages. The workload might also be risky because it allows privilege escalation, runs as root, lacks limits, or uses unsafe pod settings. Those are different problems, and Trivy Operator reports them through different Kubernetes resources.
If reports do not show up immediately, check the operator:
kubectl get pods -n trivy-system
kubectl logs -n trivy-system deploy/trivy-operator
Depending on your configuration, you may also see scanner jobs being created:
kubectl get jobs -A | grep trivy
The exact job behavior can vary by Trivy Operator version and configuration,but the model is the same.
That is the main thing to internalize before looking at the reports themselves. This is not just scanner output anymore. It is Kubernetes-native security data. That makes the results much easier to consume later. A human can use kubectl. A script can query the API. A dashboard can aggregate the reports. An MCP or agent workflow can read the objects and reason over them.
Before getting too fancy with any of that, though, we need to inspect what actually got generated.
Inspecting the Reports
At this point, Trivy Operator has done the thing we wanted to prove. We created a workload, the operator noticed it, and reports appeared in the cluster.
For the demo workload, the two most important reports are:
kubectl get vulnerabilityreports -n default
kubectl get configauditreports -n default
In my lab, the intentionally stale nginx:1.16 deployment generated reports like this:
NAMESPACE   NAME                                           REPOSITORY      TAG    SCANNER
default     replicaset-trivy-demo-nginx-855b887fb-nginx    library/nginx   1.16   Trivy
And for config auditing:
NAMESPACE   NAME                                    SCANNER
default     replicaset-trivy-demo-nginx-855b887fb   Trivy
That naming tells us something useful. The VulnerabilityReport is tied to the workload image. In this case, the report name includes the ReplicaSet and container name:
replicaset-trivy-demo-nginx-855b887fb-nginx
The ConfigAuditReport is tied to the workload object itself:
replicaset-trivy-demo-nginx-855b887fb
Vulnerability scanning answers what is wrong inside the image?
Config auditing answers what is risky about how Kubernetes is running it?
Those are related, but they are not the same problem of course.
Inspecting the VulnerabilityReport
The describe view is useful for a quick human-readable look. It should show summary counts and individual vulnerabilities found in the image, except it is generally too long. The summary gives you counts by severity. That is useful for quick triage. So just use something like this to get the summary:
matt@ciliumcontrolplane:~/trivy$ kubectl get vulnerabilityreports -A -o json | jq -r '
  ["NAMESPACE","IMAGE","TAG","CRIT","HIGH","MED","LOW"],
  (.items[]
  | [
      .metadata.namespace,
      .report.artifact.repository,
      .report.artifact.tag,
      ((.report.summary.criticalCount // 0) | tostring),
      ((.report.summary.highCount // 0) | tostring),
      ((.report.summary.mediumCount // 0) | tostring),
      ((.report.summary.lowCount // 0) | tostring)
    ])
  | @tsv
' | column -t
NAMESPACE     IMAGE                    TAG                                                          CRIT  HIGH  MED  LOW
default       library/nginx            1.16                                                         39    123   166  26
kube-system   cilium/cilium-envoy      v1.35.9-1767794330-db497dd19e346b39d81d7b5c0dedf6c812bcc5c9  0     1     46   29
kube-system   kube-proxy               v1.33.7                                                      4     34    23   26
kube-system   kube-controller-manager  v1.33.7                                                      3     30    14   2
kube-system   etcd                     3.5.21-0                                                     9     142   53   5
kube-system   kube-apiserver           v1.33.7                                                      3     30    14   2
kube-system   kube-scheduler           v1.33.7                                                      3     28    14   2
kube-system   cilium/operator-generic  v1.18.6                                                      3     29    13   2
kube-system   coredns/coredns          v1.12.0                                                      3     34    19   1
trivy-system  aquasec/trivy-operator   0.30.1                                                       3     35    20   2
The individual vulnerability entries are where the detail lives. Each finding can include information like:
Vulnerability ID
Package name
Installed version
Fixed version
Severity
Title
Primary link
That gives us the classic vulnerability scanner view:
This image contains this package.
This package has this CVE.
This version is installed.
This version fixes it.
Give it a try as follows to just grab the first vuln:
matt@ciliumcontrolplane:~/trivy$ kubectl get vulnerabilityreport \
  -n default replicaset-trivy-demo-nginx-855b887fb-nginx \
  -o json | jq '.report.vulnerabilities[0] | {
    vulnerabilityID,
    resource,
    installedVersion,
    fixedVersion,
    severity,
    title,
    primaryLink
  }'
{
  "vulnerabilityID": "CVE-2020-27350",
  "resource": "apt",
  "installedVersion": "1.8.2",
  "fixedVersion": "1.8.2.2",
  "severity": "MEDIUM",
  "title": "APT had several integer overflows and underflows while parsing .deb pa ...",
  "primaryLink": "https://avd.aquasec.com/nvd/cve-2020-27350"
}
The VulnerabilityReport gives us structured image risk data. It is something we can query, summarize, enrich, and eventually correlate with other context.
Inspecting the ConfigAuditReport
Now look at the config audit report (which are not crazy long):
kubectl describe configauditreport \
  -n default replicaset-trivy-demo-nginx-855b887fb
This report is not looking inside the image for vulnerable packages. It is looking at Kubernetes configuration and asking whether the workload is being run safely.
In this demo deployment we intentionally included a weak security context:
securityContext:
  allowPrivilegeEscalation: true
  runAsNonRoot: false
They are workload configuration risks. Things we've seen with Kyverno, kube-bench, etc. The Trivy checks look to map to Kubernetes security recommendations via the aqua vuln database. The report may flag things like:
Container allows privilege escalation
Container runs as root
Security context is missing
Resource limits are not set
Host namespaces are used
Dangerous capabilities are allowed
This is the part where Trivy Operator starts to feel less like a plain image scanner.
The VulnerabilityReport tells us about image hygiene. The ConfigAuditReport tells us about workload posture.
Together, they tell us what am I running, what is inside it, and how risky is the way I am running it. While Trivy Operator is not a life coach, it helps to produce structured findings we can actually use.
Why the Report Shape Matters
The most important part is not just that Trivy found vulnerabilities or config issues. The important part is where the findings now live. They are not buried in a terminal buffer. They are not sitting in a random JSON file on someone’s laptop. They are Kubernetes resources.
That means we can query them the same way we query other cluster state:
kubectl get vulnerabilityreports -A
kubectl get configauditreports -A
We can pull them as YAML or JSON:
kubectl get vulnerabilityreports -A -o yaml
kubectl get configauditreports -A -o json
We can script against them:
kubectl get vulnerabilityreports -A \
  -o jsonpath='{range .items[*]}{.metadata.namespace}{" "}{.metadata.name}{" critical="}{.report.summary.criticalCount}{" high="}{.report.summary.highCount}{"\n"}{end}'
For a human, these reports are easy enough to inspect with kubectl.
For a system, they are structured objects that can be collected, normalized, summarized, and correlated with other signals.
That is why Trivy Operator is interesting here. Not because it magically solves vulnerability management. It does not. It is interesting because it turns scan results into Kubernetes-native security data. Once the findings live there, the next question becomes much more useful:
What should consume these reports, and what context should we add next?
Other Reports Worth Knowing
The two reports I care about most for this walkthrough are VulnerabilityReport and ConfigAuditReport, because they show the two most common scanning questions:
What is inside the image?
How is Kubernetes running it?
But Trivy Operator can generate other report types too.
In the lab, the operator did not only create reports for the demo nginx:1.16 workload. It also generated reports for system components, services, and RBAC objects across namespaces like kube-system, trivy-system, and cilium-secrets.
Trivy Operator is not just watching one deployment because I asked nicely. It is watching Kubernetes resources and producing different report types based on what it finds.
Here is the quick version.
| Report | What it answers | Why it matters |
|---|---|---|
VulnerabilityReport |
What CVEs exist in this image? | Image patching and vulnerability inventory |
ConfigAuditReport |
Is this workload configured safely? | Kubernetes posture and workload hardening |
ExposedSecretReport |
Did Trivy find exposed secrets? | Credential leakage and accidental secret exposure |
RbacAssessmentReport |
Are RBAC permissions risky? | Identity, privilege, and blast radius |
InfraAssessmentReport |
Are there infrastructure-level findings? | Node or cluster context depending on configuration |
ClusterComplianceReport |
How do findings map to compliance controls? | Audit and benchmark-style reporting |
The really nice part is that each report type answers a different security question. A vulnerability finding, a workload configuration finding, and an RBAC finding should not all be treated as the same generic blob of scanner sadness.
A vulnerable image usually means updating a base image, rebuilding an application image, or accepting risk if the vulnerable package is not reachable.
A config audit finding usually means changing the workload spec. Maybe the container should run as non-root. Maybe privilege escalation should be disabled. Maybe resource limits should exist because apparently we still need to say that out loud.
An RBAC finding points somewhere else entirely. That is about identity, permissions, and blast radius. Fixing it may mean changing a Role, ClusterRole, RoleBinding, or ServiceAccount.
That is why the report type is useful context. It gives the consumer a hint about what kind of risk it is dealing with.
A Note on Trivy Internals
One thing I am intentionally not going deep on here is how Trivy itself manages vulnerability data. However, I am not saying the scanner internals don't matter.
Vulnerability data is dynamic. Scan speed matters. Database freshness matters. False positives, missing advisories, package matching, and data reliability all matter if these reports are going to feed something larger than a local demo.
That becomes especially important for its sustained value. If these findings eventually feed an MCP workflow or security console, we need to understand more than just "Trivy found a CVE." We need to understand where the vulnerability data came from, when it was updated, how reliable it is, and whether I can enrich, override, inject, or even short-circuit parts of that process for our own use cases.
So I am going to leave the Trivy internals for a separate post.
Wrap Up
At this point, Trivy Operator has done enough to make its role pretty clear.
It watches Kubernetes resources, runs scans, and writes the results back as Kubernetes-native report objects. In the demo, a simple stale nginx:1.16 deployment generated both a VulnerabilityReport and a ConfigAuditReport, while the rest of the cluster also had reports for system workloads, services, and RBAC objects.
That is the part I care about. Trivy Operator is not just producing scanner output. It is producing typed security findings inside the cluster.
Trivy Operator is the scanning layer. It tells you what it found. It does not block a risky workload from being admitted. It does not stop a process at runtime. It does not tell you whether a vulnerable package was actually exploited. And it definitely does not magically solve vulnerability management.
But it gives you useful raw material. The VulnerabilityReport tells you what is risky inside the image. The ConfigAuditReport tells you what is risky about the workload configuration. The ExposedSecretReport points toward possible credential leakage. The RbacAssessmentReport gives you identity and permission context.
Trivy Operator makes scanning Kubernetes-native.
That matters because once security findings exist as Kubernetes resources, they become much easier to build on. They can feed dashboards, scripts, reports, MCP workflows, or whatever slightly-overengineered-but-probably-useful security console idea comes next.